
Crypto Portfolio Risk Dashboard
TL;DR
I built a full-stack dashboard that calculates time‑weighted and money‑weighted returns, institutional risk ratios (Sharpe, Sortino, Calmar), max drawdowns, rolling volatility, and multi‑method Value‑at‑Risk (VaR) & Expected Shortfall (ES) for a live crypto portfolio.
It supports historical, parametric (Normal & Student‑t), and Monte Carlo VaR with configurable horizons and confidence levels, plus forward risk cones and VaR backtesting.
The codebase is production‑minded: typed Python, unit tests, FastAPI endpoints, caching, containerization, and a modular architecture designed to extend to stress tests, regimes, and attribution.
What it does today
Portfolio & Performance
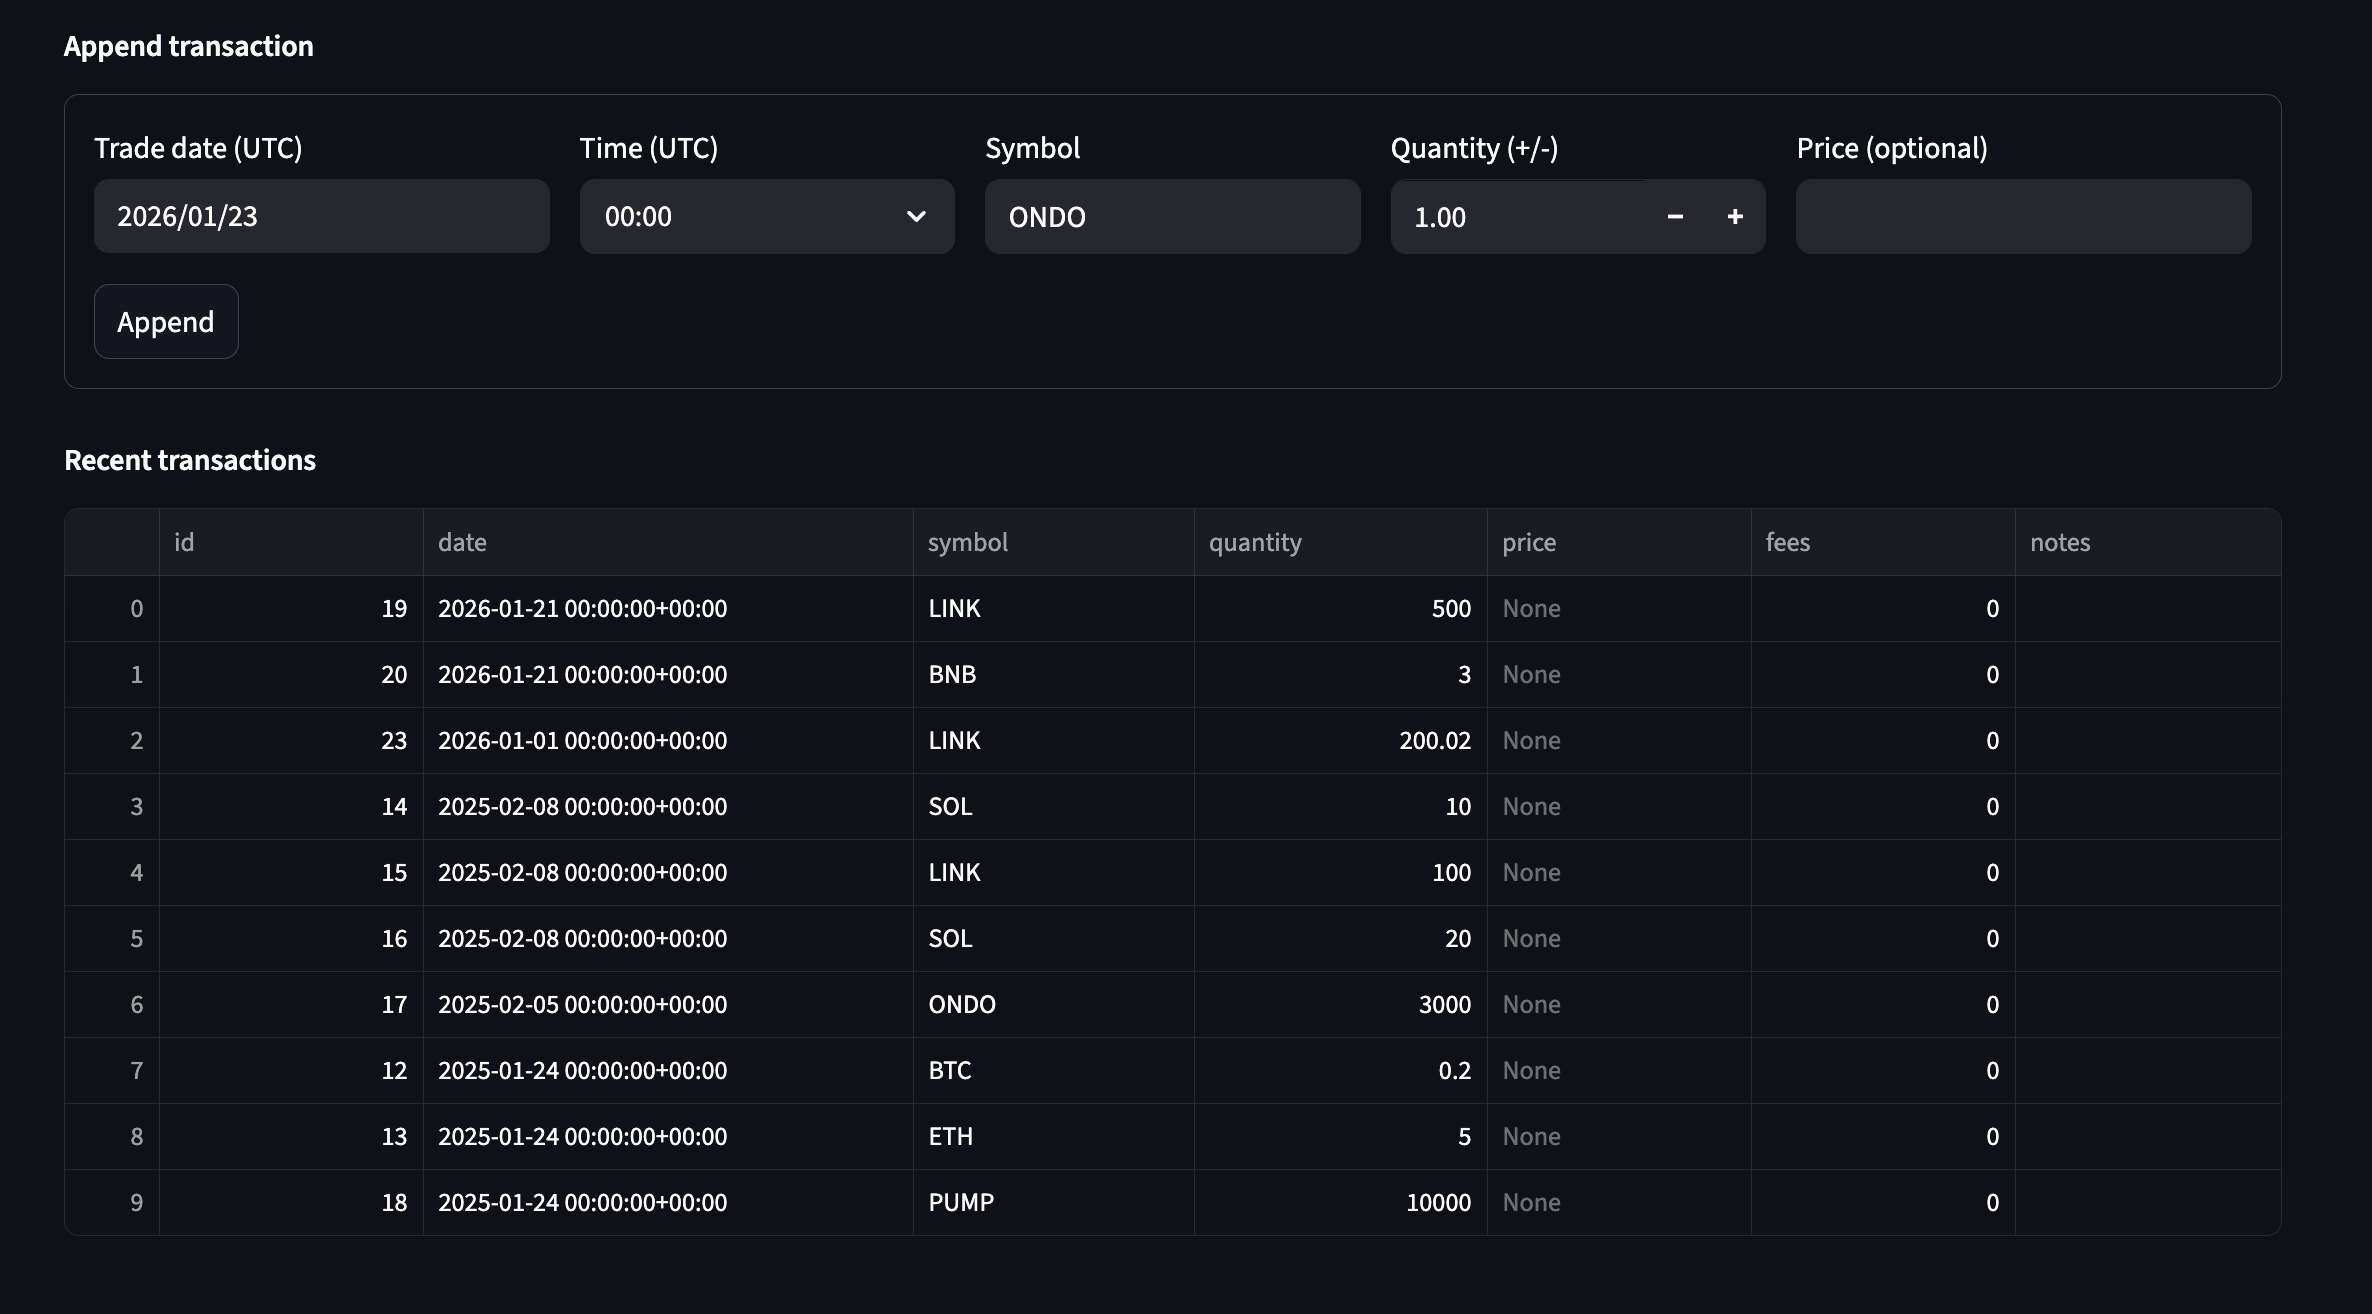
Add/remove assets; compute holdings → weights → daily portfolio returns.
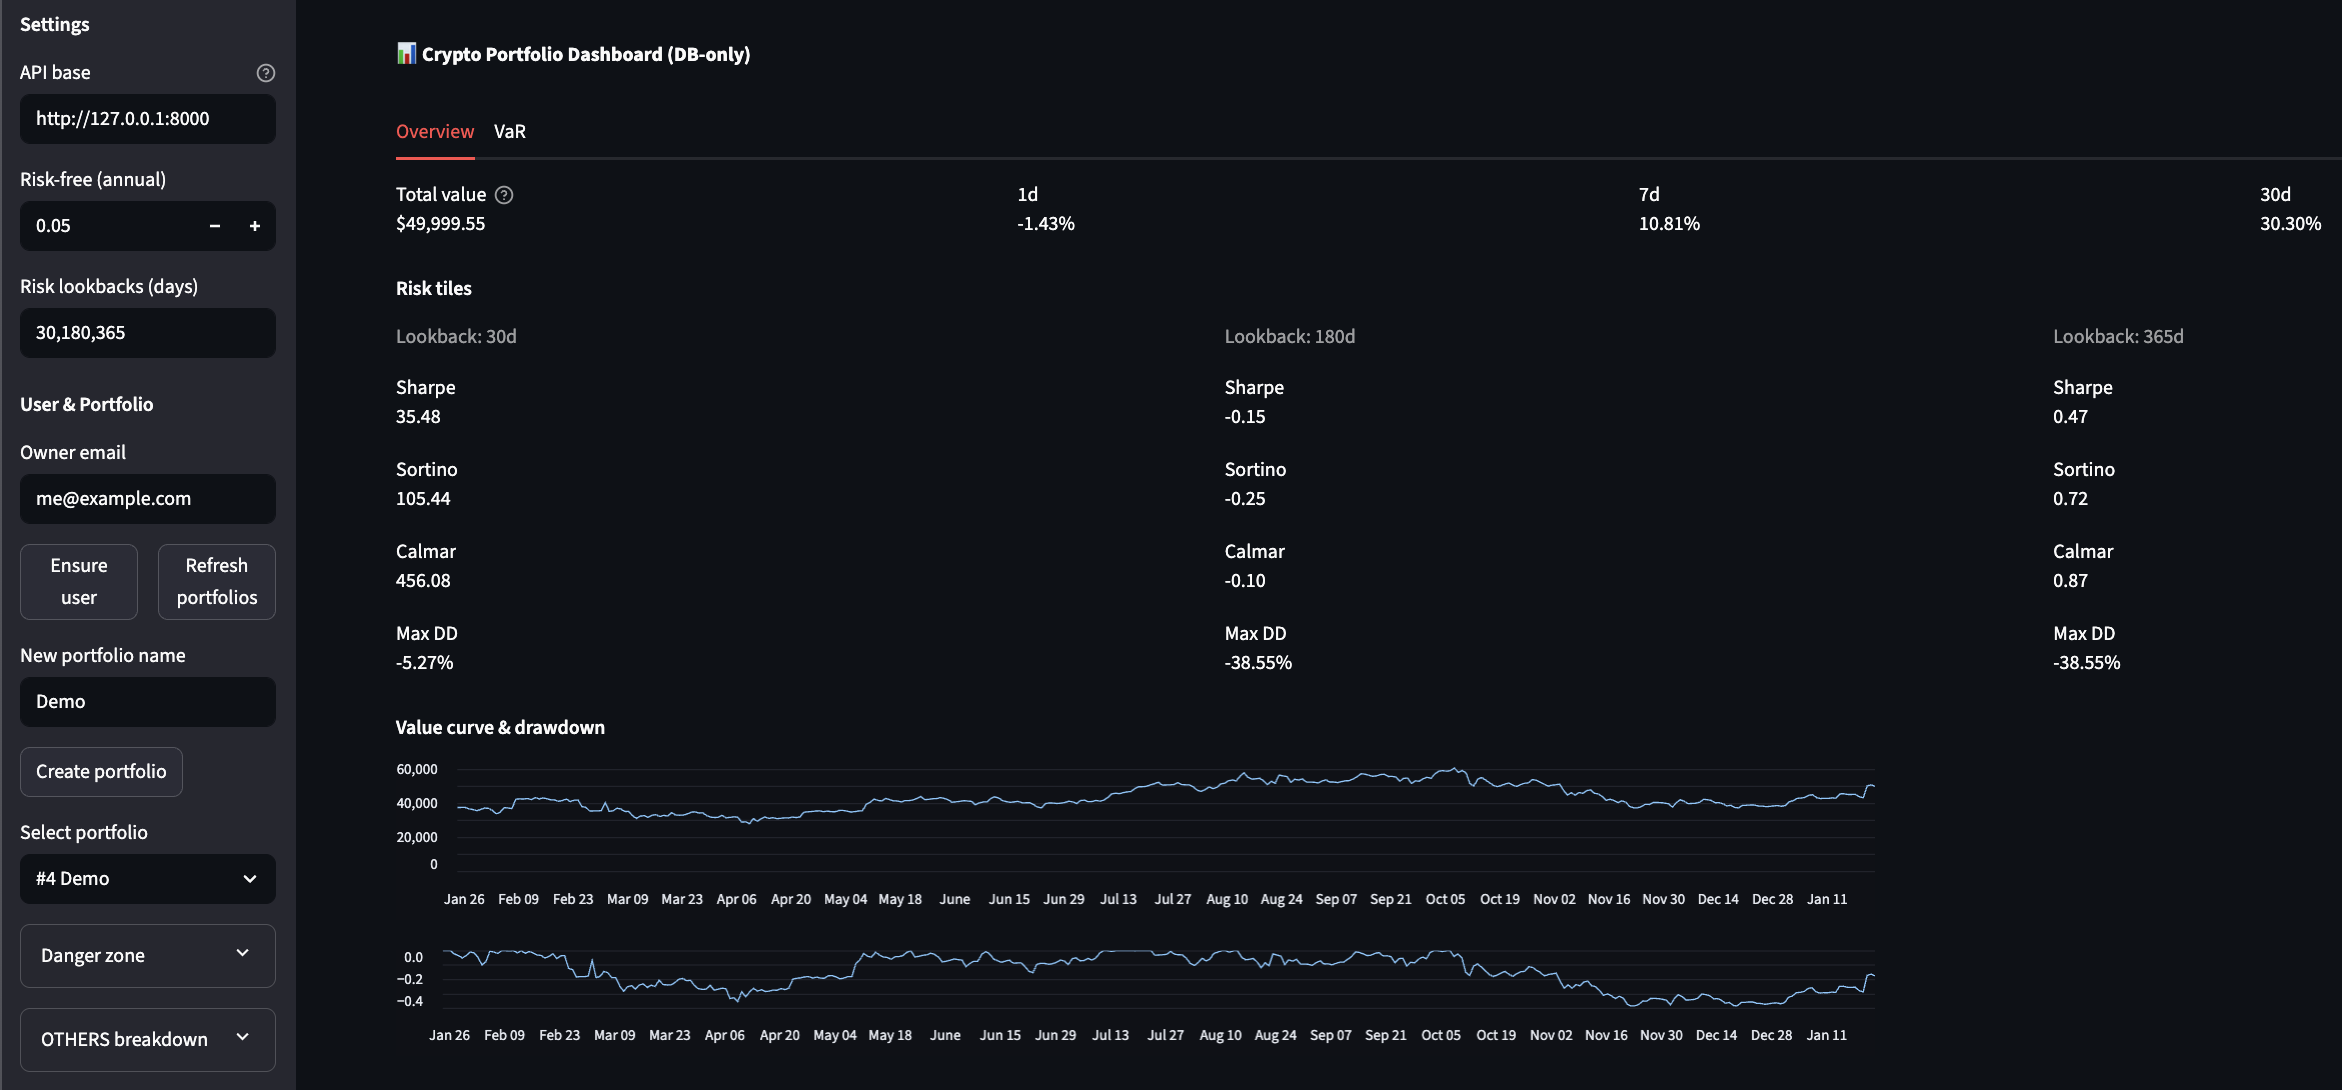
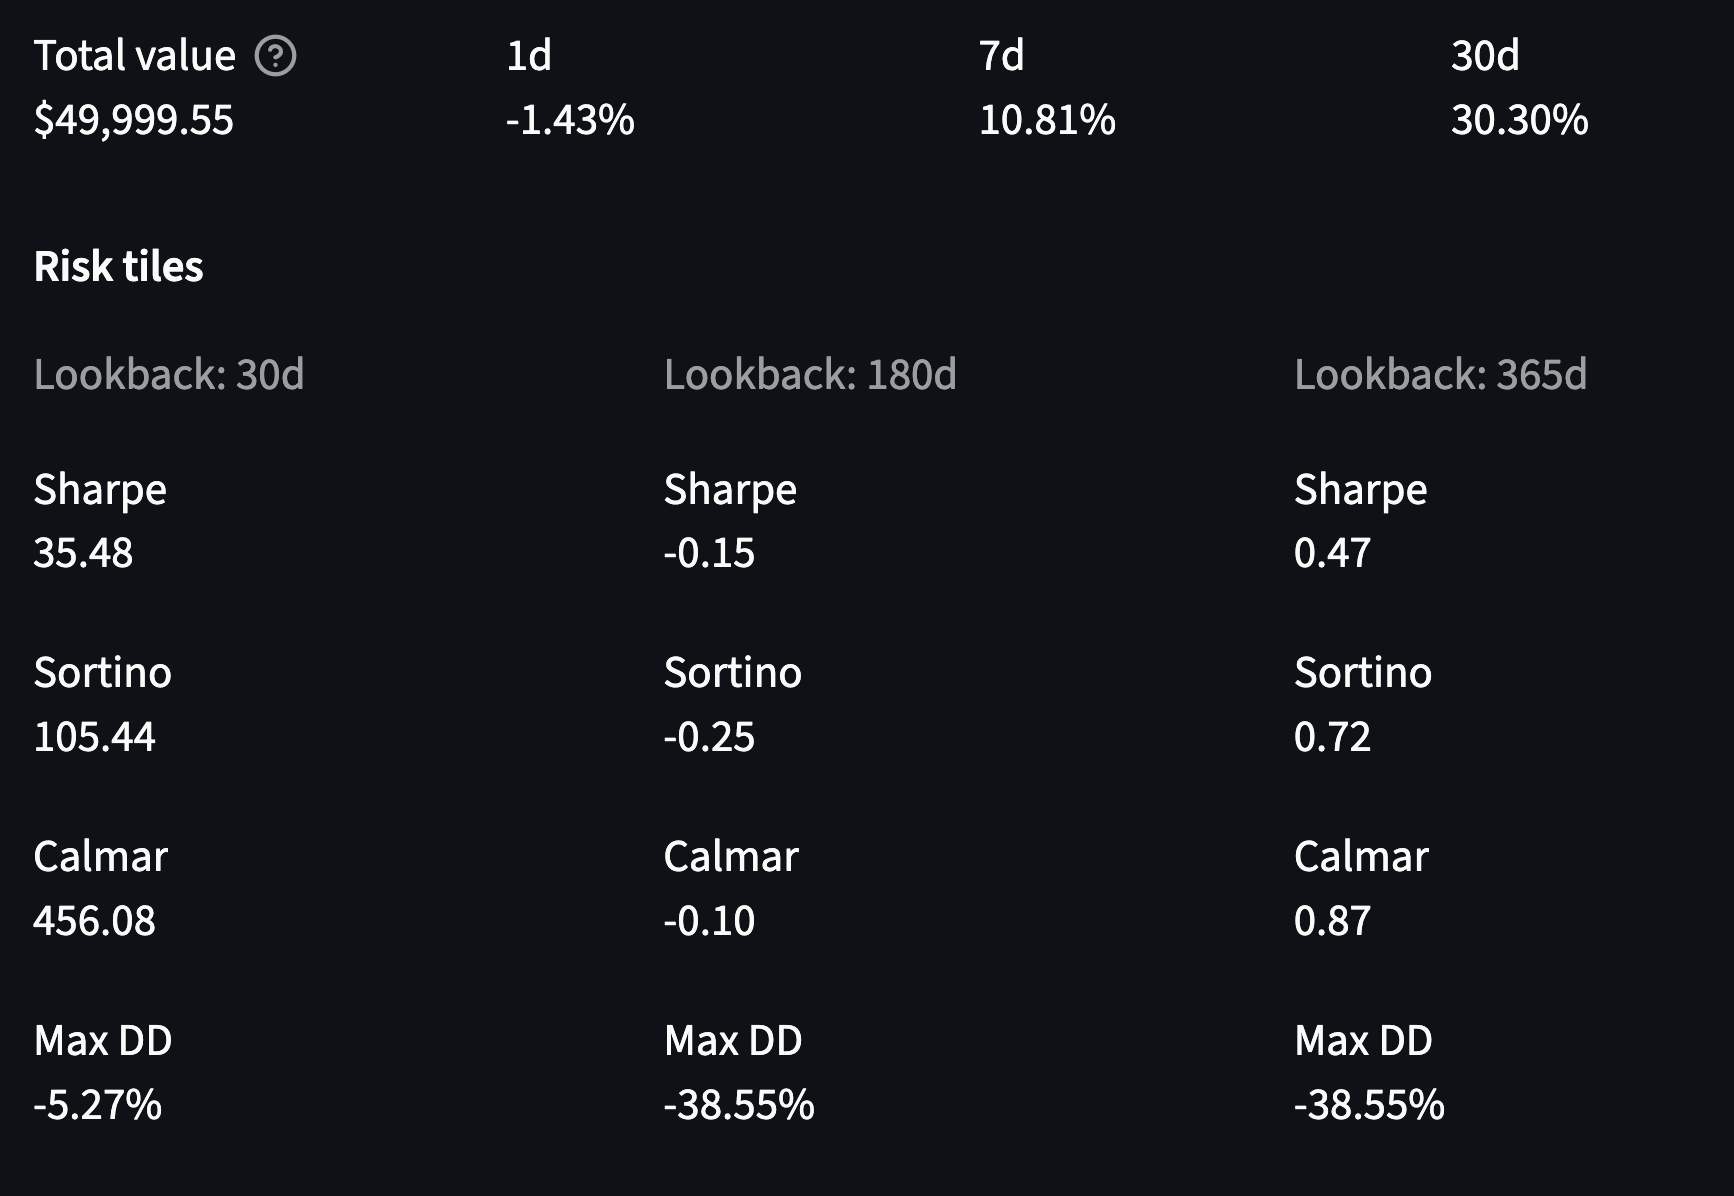
Summary tiles for 1D / 7D / 1M performance.
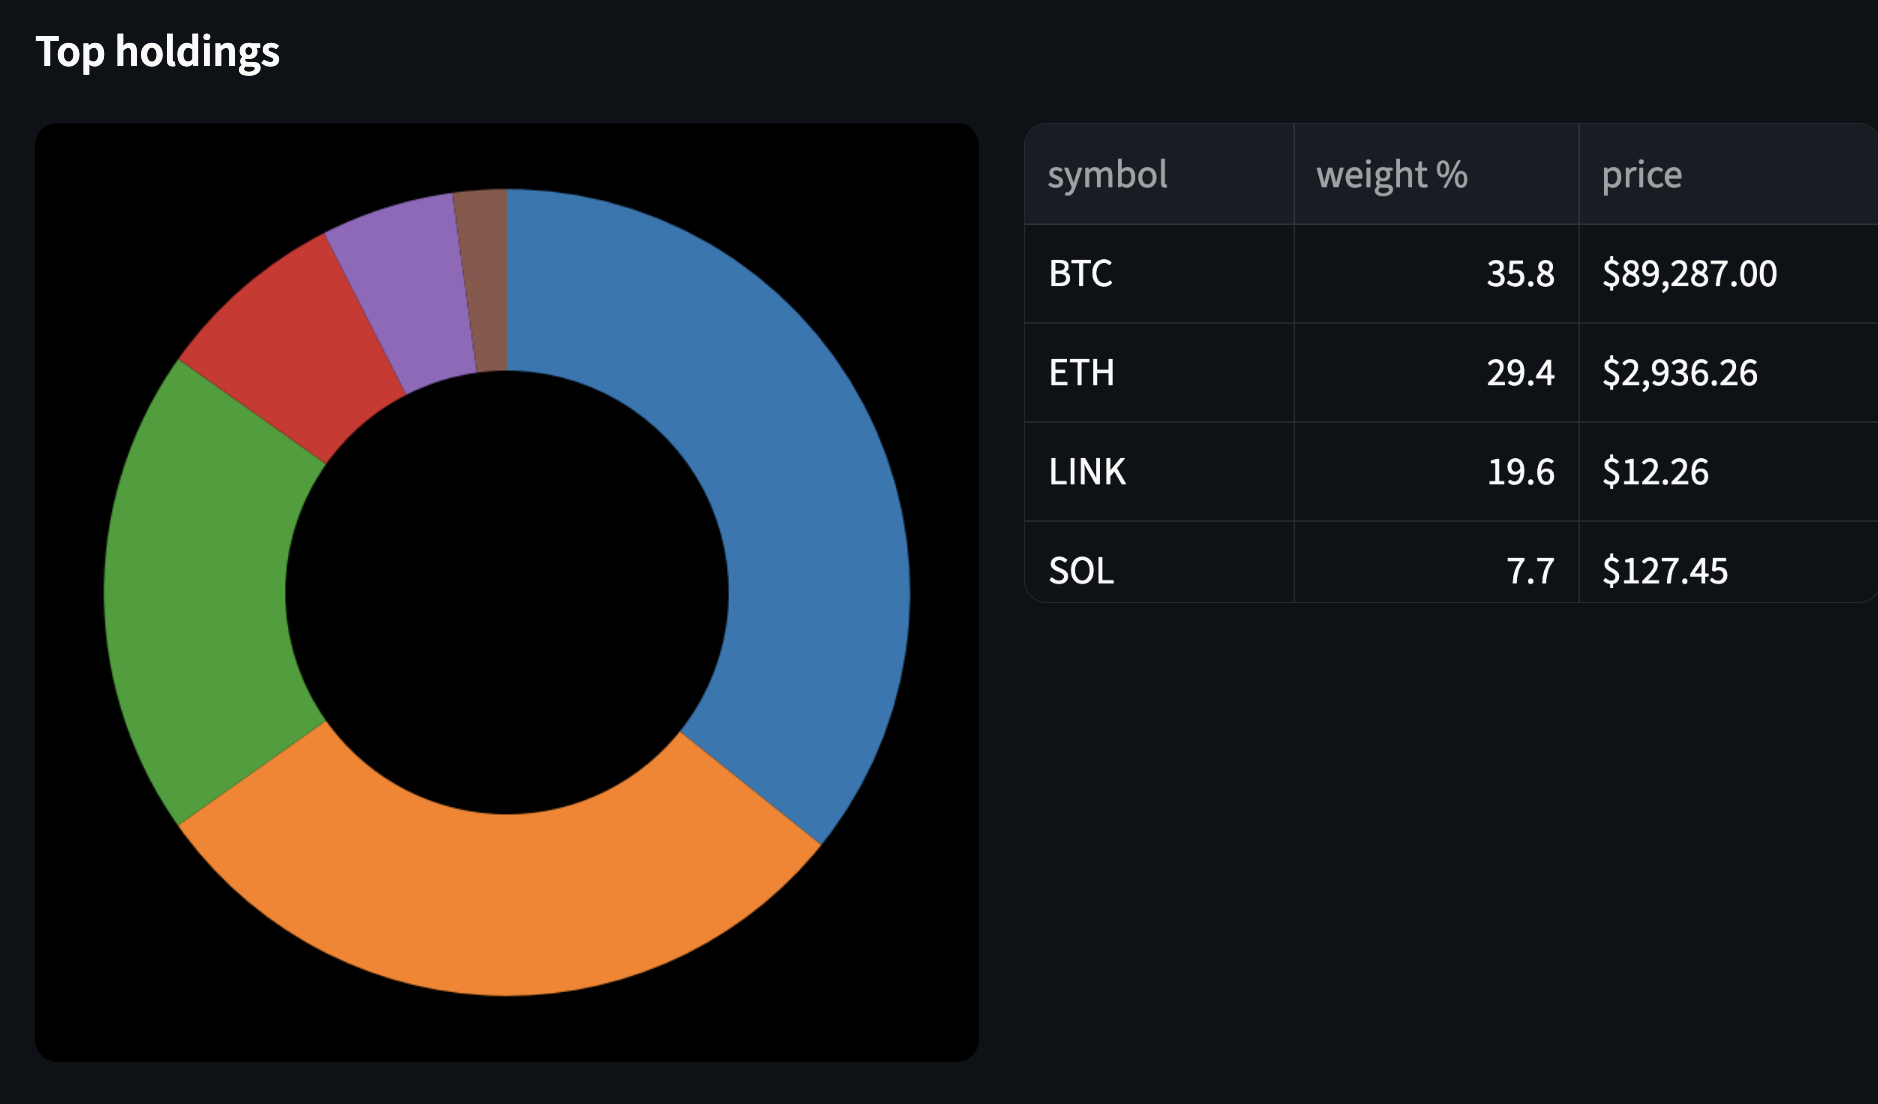
Top holdings with portfolio weight, current price, and trade history.
Risk & Ratios
Sharpe, Sortino, Calmar, and max drawdown over 1M / 6M / 1Y windows.
Rolling volatility and drawdown series to visualize risk through time.
VaR & Tail‑Risk
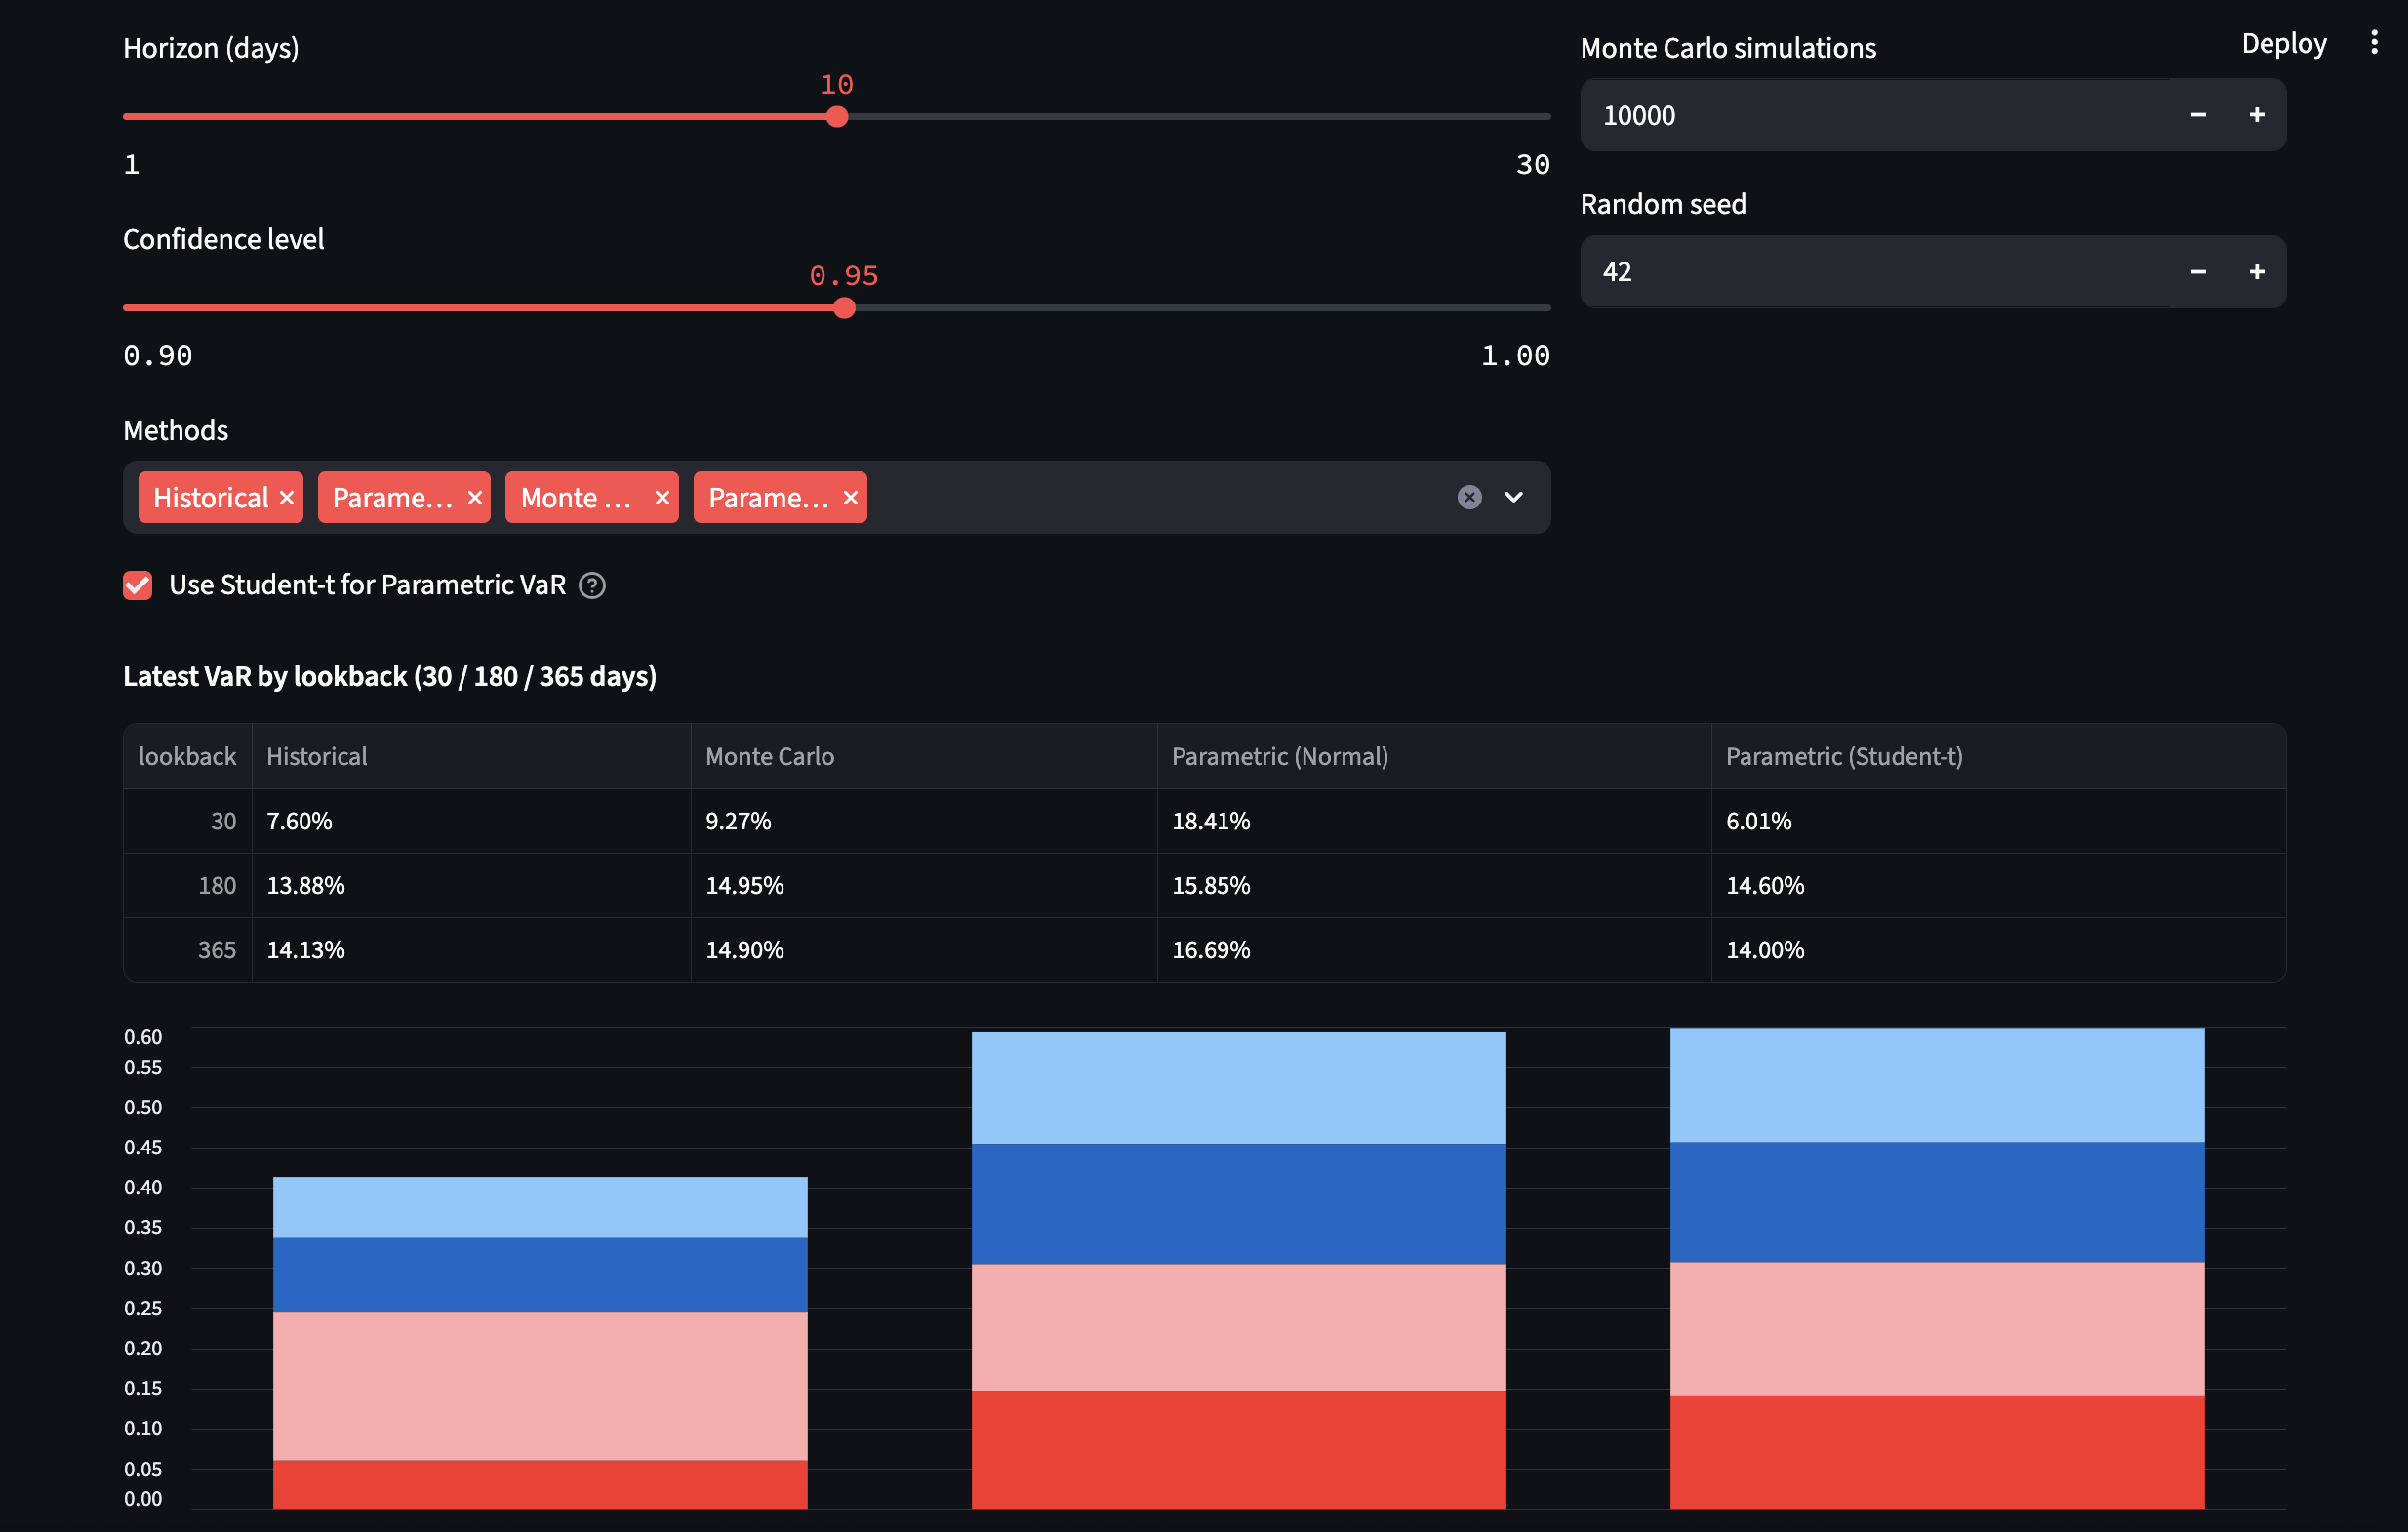
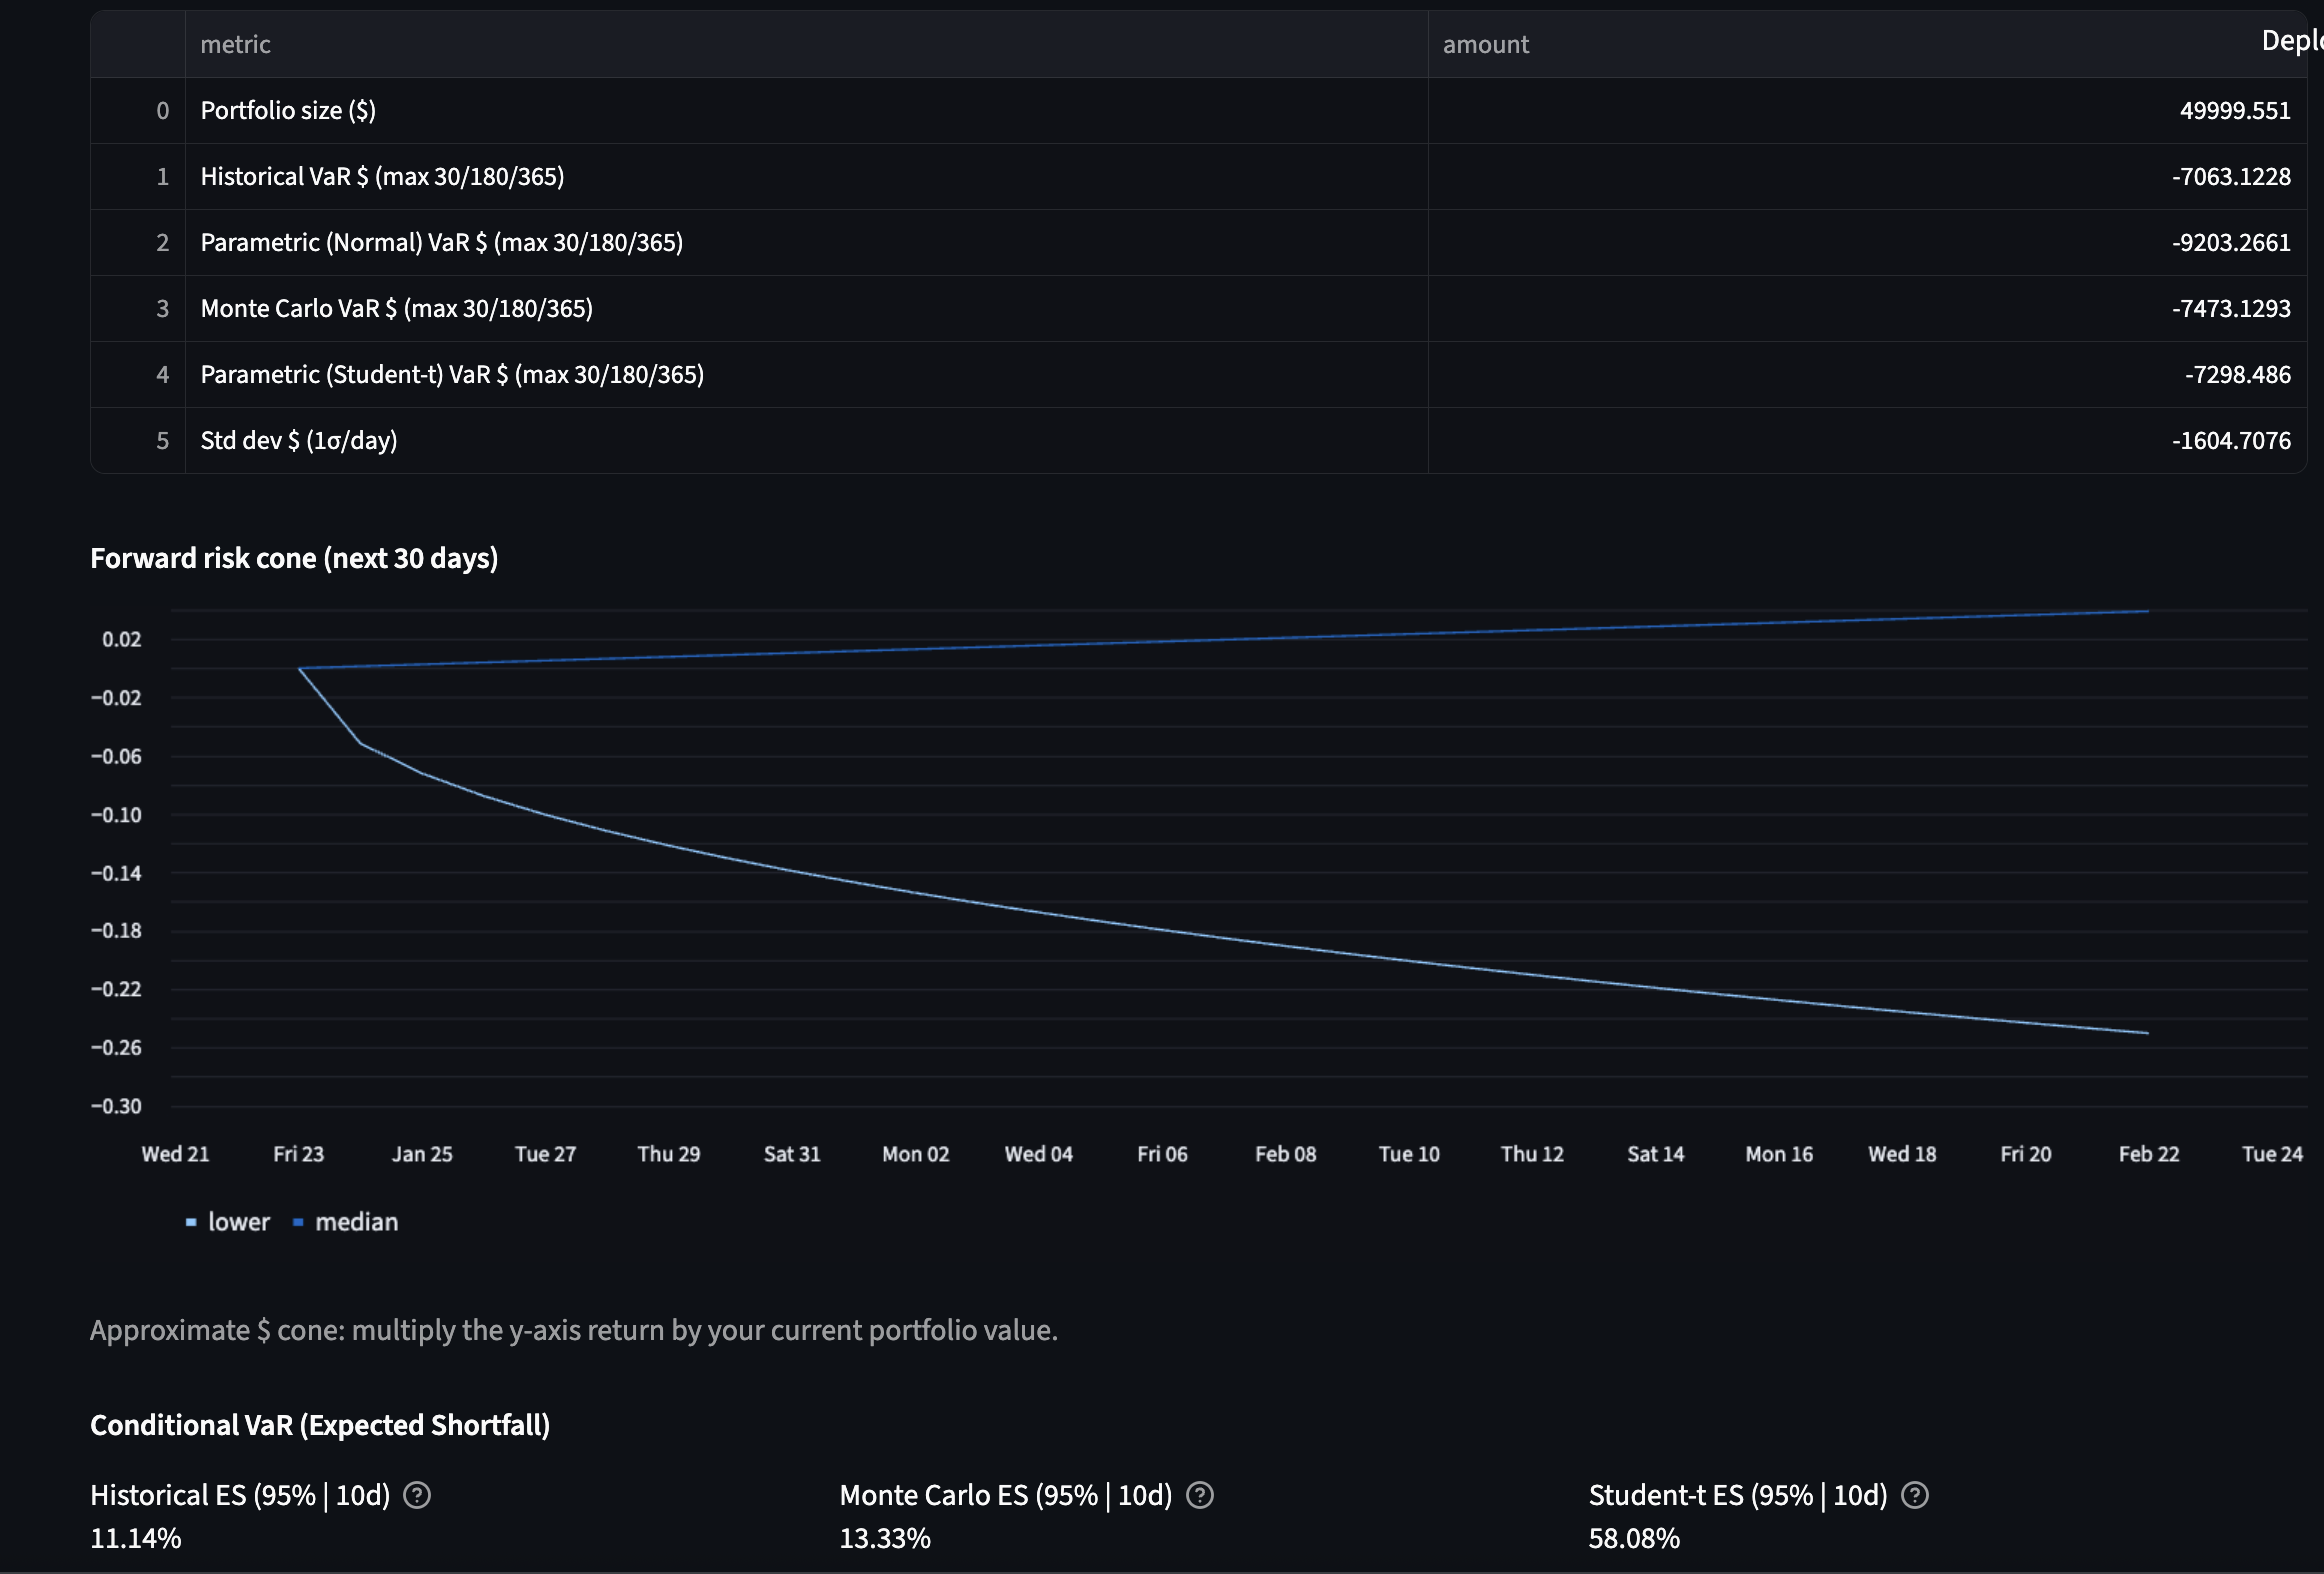
Historical VaR, Parametric VaR (Normal & Student‑t to capture leptokurtosis), and Monte Carlo VaR.
Adjustable horizon (1 / 10 / 30 days) and confidence (0.90–0.99).
Controls for MC simulation count and random seed for reproducibility.
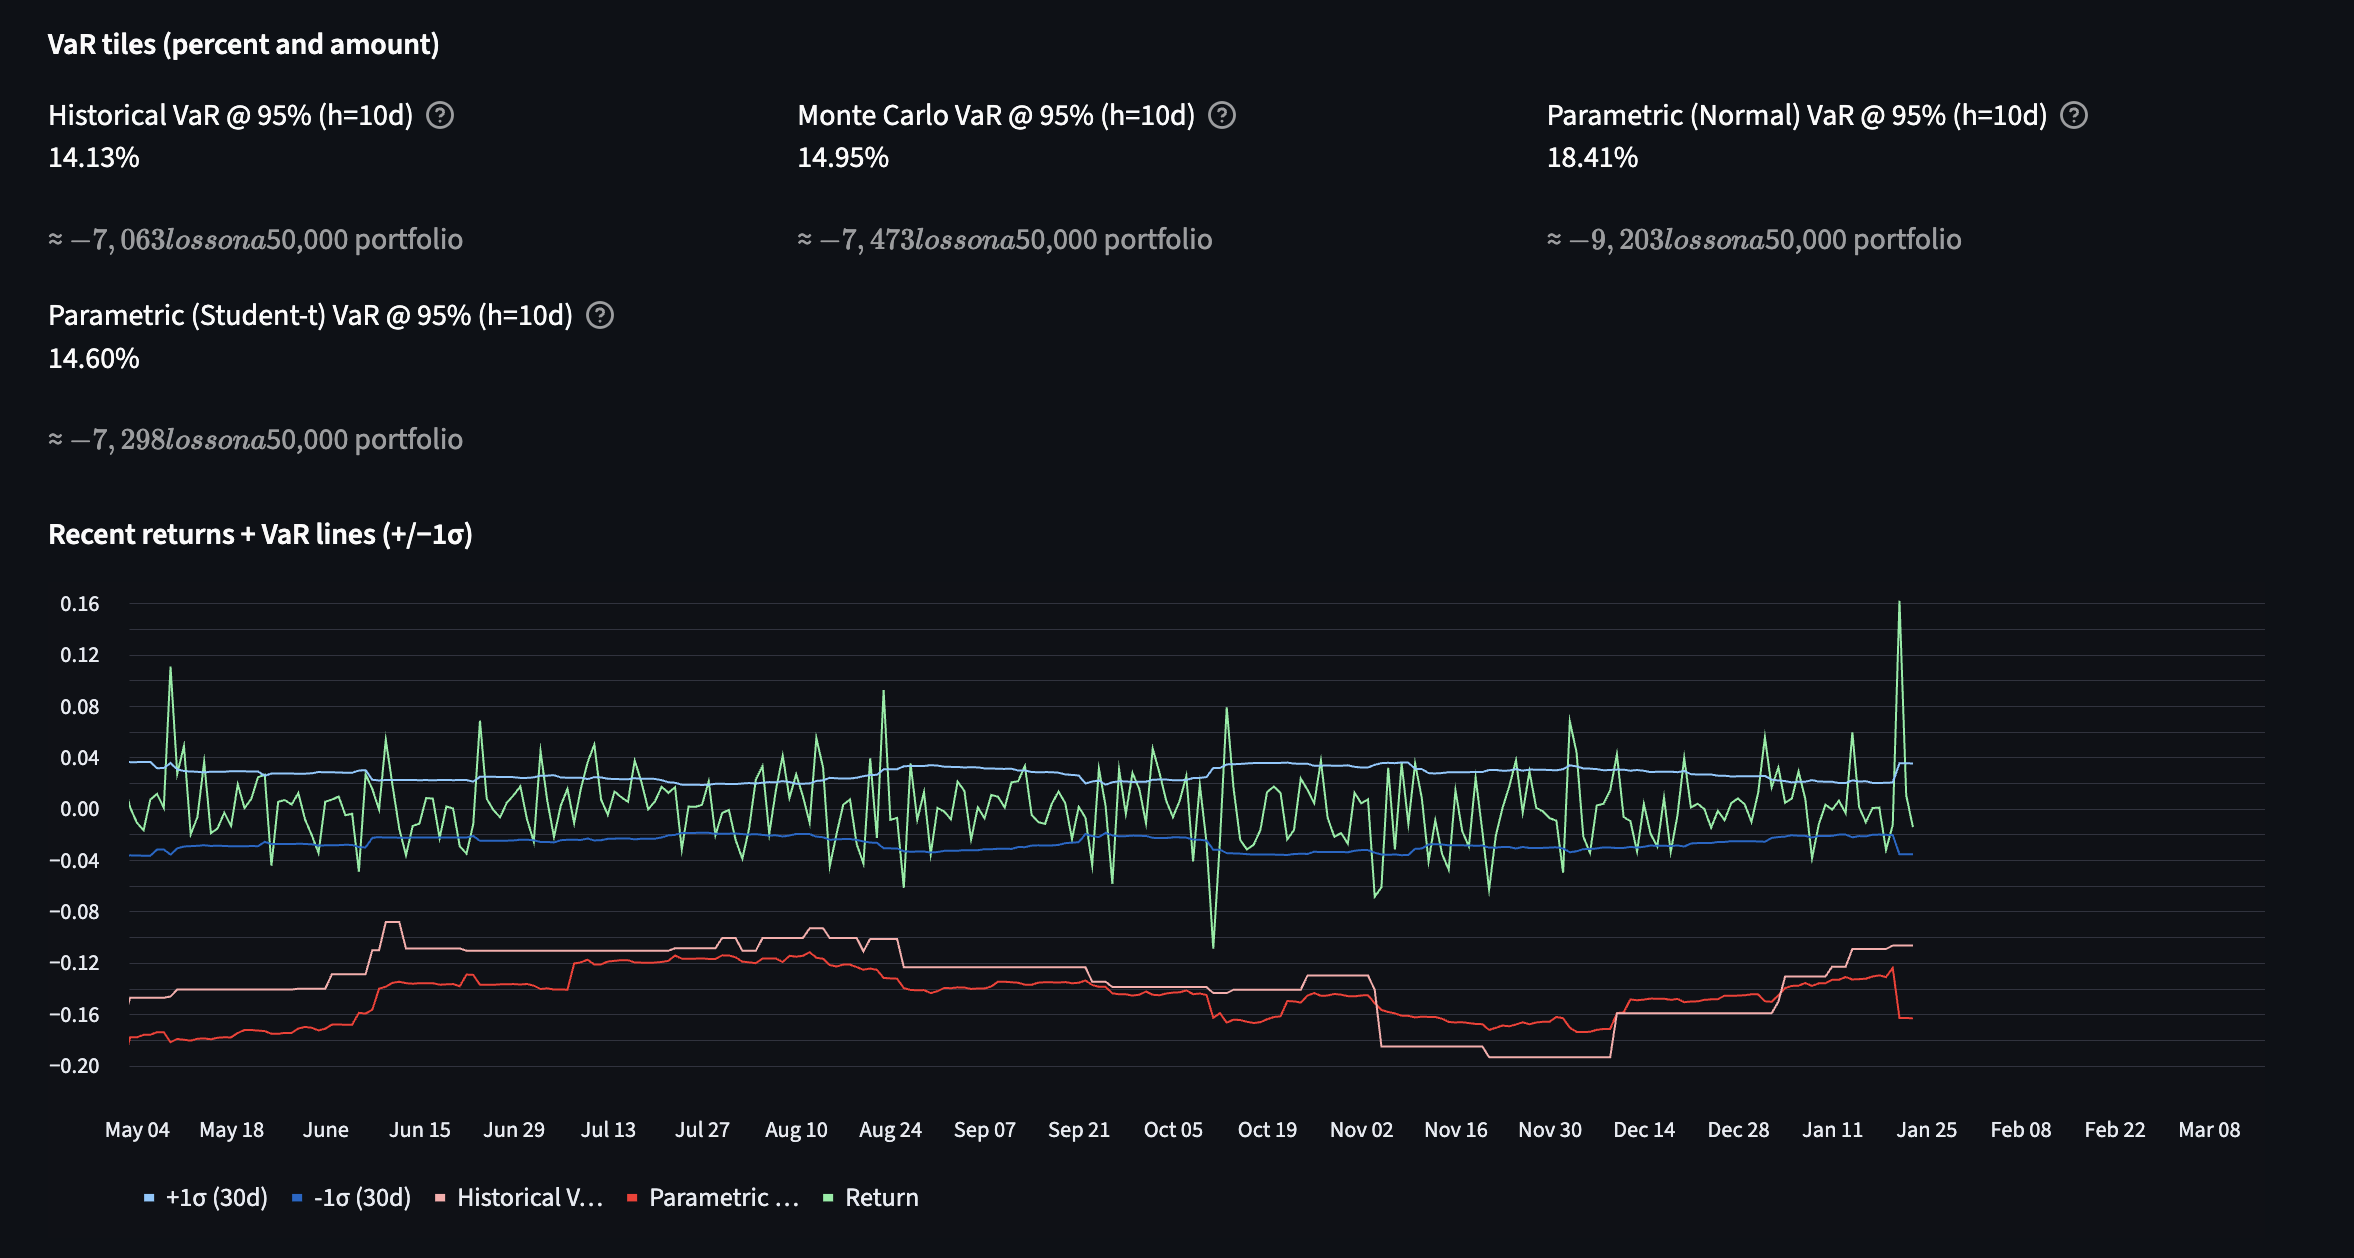
Daily return line with rolling 30‑day σ, and overlaid historical & parametric VaR bands to visualize tail risk.
Forward 30‑day risk cone, Expected Shortfall (CVaR), and monetary loss ranges by horizon/confidence.
UX
Clear bar/line charts, horizon toggles, and risk tiles for quick scannability.
Roadmap (next jobs)
Portfolio analytics
Portfolio variance/volatility; correlation & covariance matrix with shrinkage (e.g., Ledoit–Wolf).
Beta/exposures vs BTC and macro factors; sensitivity to single‑asset shocks.
Benchmarking (BTC, ETH, custom basket) with excess returns and Information Ratio.
Risk & attribution
VaR decomposition (Euler) to see each asset’s contribution to portfolio VaR/ES.
Backtesting of VaR exceptions (e.g., Kupiec/Christoffersen tests) with exception logs.
Stress & regimes
Historical replays (e.g., major sell‑offs, liquidity shocks) and hypothetical shocks.
Regime tagging (volatility states) with summary stats by regime.
Practicalities
Fees/slippage assumptions; transaction‑cost‑aware returns.
Data validation (staleness/NaN guards), monitoring, and alerts.
CSV/PNG export, dark mode, and layout polish.
Options & hedging (stretch)
What‑if put hedges and delta‑hedged overlays; P&L impact by strike/tenor.
Why I built it
Most portfolio trackers show balances and P&L. Few measure risk the way professionals do. I wanted:
A clean layout with asset distribution, weights, and position details.
Proper performance: TWR vs MWR, benchmarkable across horizons.
Risk ratios: Sharpe, Sortino, Calmar, rolling vol, and max drawdown.
Tail‑risk analytics: VaR, ES, forward risk cones, and heavy‑tail models (Student‑t).
Relationships between assets: correlations now, factor/regime analysis next.
This project is my answer: a personal tool with institutional features.
Architecture
A modular repo designed for extension and testing:
repo/
config/ # settings.yaml – data paths, horizons, RF source
data/ # parquet/duckdb (gitignored)
src/
io/ # loaders, calendars
portfolio/ # positions, valuation, returns (TWR/MWR)
risk/ # drawdown, ratios, covariance, var, stress
analytics/ # correlations & rolling stats
factors/ # risk-free & optional macro factors (SPX, DXY, etc.)
utils/ # time, cache, typing, logging
api/ # FastAPI endpoints + pydantic schemas
dashboards/
web/ # React front-end (or)
python/ # Dash/Plotly or Streamlit
tests/ # pytest with fixed seeds
docker/ # containerization (API + dashboard)
Engineering practices
Typed Python with docstrings; pytest unit tests and fixed seeds.
FastAPI + Pydantic for validation; clean schemas at the API boundary.
Caching and parquet/duckdb storage for fast recompute.
Docker for reproducible runs; CI‑friendly layout for future GitHub Actions.
Tech stack
Python (NumPy, pandas), FastAPI, Pydantic, PyMC/NumPy RNG for MC, Plotly/React or Dash/Streamlit for the UI, DuckDB/Parquet for storage, Docker for packaging, pytest for tests.
Work with me
I enjoy turning messy market data into clear, testable risk and performance tools. If you run digital‑asset risk or portfolio analytics and want a pragmatic builder who ships, let’s talk.
If you wish to have access to the GitHub repo to have a look please don’t hesistate to contact me.
This project is for research/education and not investment advice.