
Bitcoin Statistical Event Study
TL;DR
I built a Python event‑study engine and a primary/secondary demand valuation model for Bitcoin. It measures the impact of catalysts (institutional adoption, regulation, tech upgrades, crises, etc.) on returns across ±1/3/5/10/15/30‑day windows, then regresses the secondary premium (price – fair value) on liquidity and macro factors.
Findings: Institutional/adoption and protocol/tech upgrades drive the most persistent positive drift (weeks). Negative regulatory shocks hit on day‑1 but mean‑revert over longer windows. Dollar strength (DXY) is inversely related to next‑month BTC returns; BTC shows short‑term momentum.
Output is presented as valuation bands (bear/base/bull) for 2025 rather than a single point target, with clear attribution between structural (primary) and cyclical (secondary) components.
Why I built it
Most crypto “valuation” is narrative. I wanted a framework that:
Separates signal from noise by isolating structural adoption from cyclical enthusiasm/fear.
Quantifies event impact using standard CAR/AR windows and rigorous significance tests.
Produces an explainable fair value and a measurable premium/discount relative to that fair value.
Results – Event Study (selected highlights)
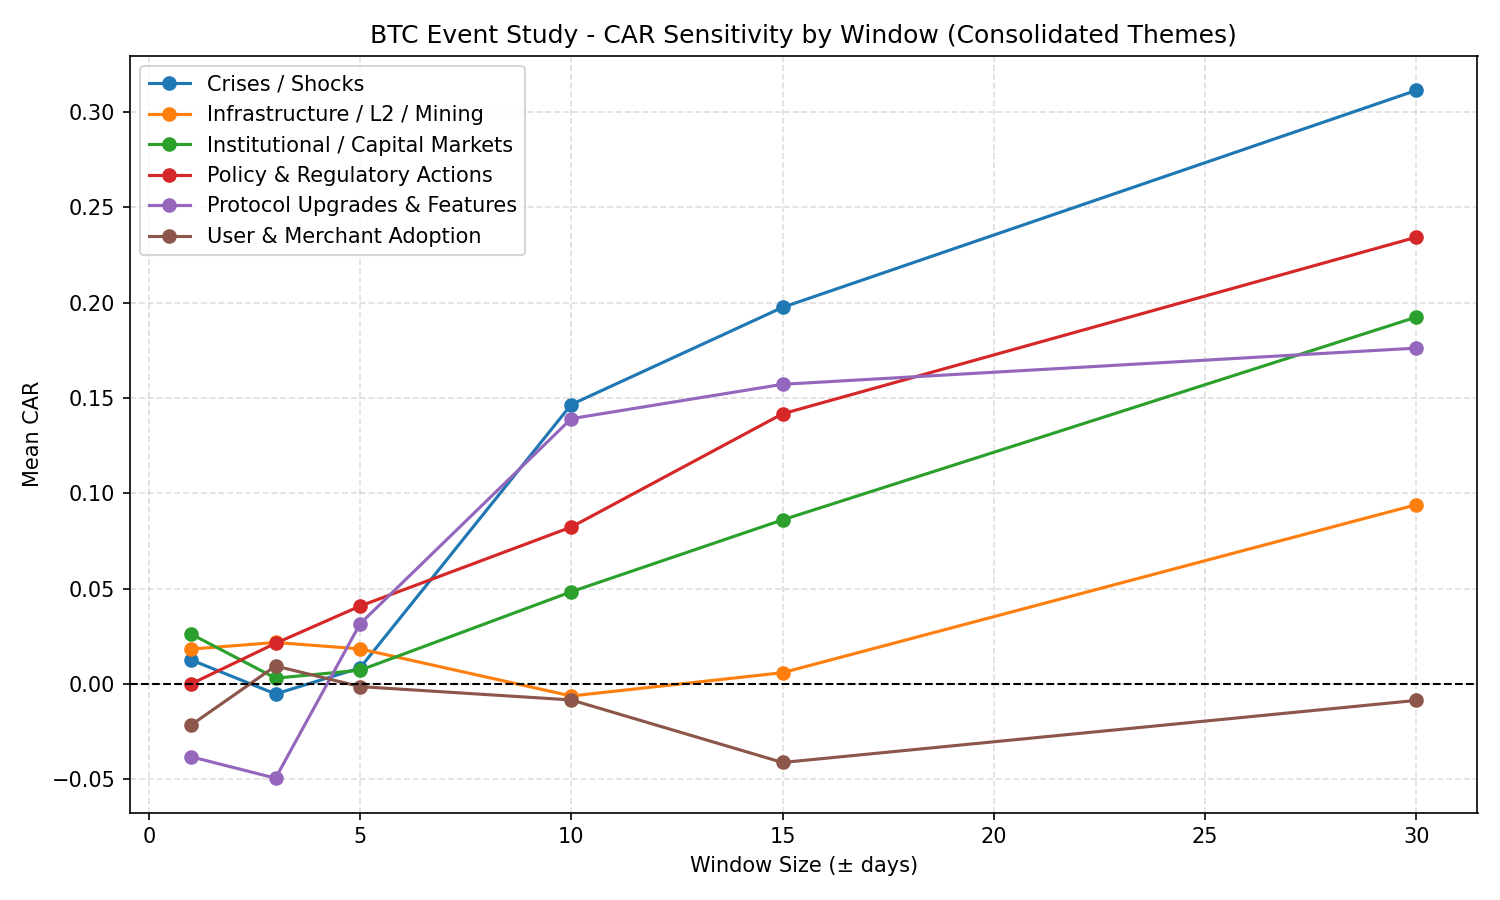
By Theme (mean CAR; significance refers to t‑tests in sample)
Institutional Adoption: positive and persistent; significance emerges by ±3–5d and strengthens through ±15–30d.
Protocol/Technological Upgrades: effects build with horizon; insignificant near ±1d, significant by ±15–30d.
Policy/Regulation (mixed): small in short windows; positive drift at longer windows; polarity matters.
Crises & Stress: muted on impact; no consistent sustained drawdown on average.
Market Infrastructure/Liquidity: positive but not significant; likely gradual/anticipated.
Adoption/Usage: small sample; directionally positive at longer windows, not conclusive.
Regulatory Polarity
Negative regulatory events: day‑1 selloff (significant), but mean‑reversion by ±15–30d.
Positive regulatory events: immediate upside; persistence varies with context; sample size smaller.
Roadmap (next)
Data & Taxonomy
Expand labeled events; add polarity, magnitude, and surprise scores.
Attach on‑chain features (LTH %, realized cap, fee pressure) at event timestamps.
Modeling
VaR‑style exception tests for event‑driven drawdowns.
Attribution: Euler contributions of factors to secondary premium variance.
State space/Markov regimes for premium dynamics (calm/elevated/panic).
Out‑of‑sample validation and rolling re‑fit.
Productization
Bundle as a FastAPI microservice; add dashboard tiles (heatmap, premium band).
Standardize / rescale inputs (z-scores) to reduce condition-number issues and improve numerical stability.
Try lag=1 VAR (BIC/HQIC choice) and compare true OOS performance (rolling/expanding window).
Make sure everything is stationary (ADF tests). If ISM is a level, it may be problematic; consider changes or surprises (diff from expectations).
Use robust inference (HAC / Newey-West for OLS; robust covariance options for VAR where possible).
Add variables that actually move crypto at short horizons: SPX/Nasdaq returns, VIX, credit spreads, liquidity proxies, BTC realized vol, funding rates, etc.
Consider nonlinear / regime approaches (Markov switching, tree-based models, quantile regression) because linear-Gaussian VARs struggle with fat tails and regime shifts.
What it does today
Event Study Engine
Curated event taxonomy (Institutional/Adoption, Protocol/Tech, Policy/Regulatory ± polarity, Market Infrastructure/Liquidity, Crises & Stress, Usage/Commerce).
Computes abnormal returns (AR) and cumulative abnormal returns (CAR) over ±1/±3/±5/±10/±15/±30 windows.
Summarizes mean CAR, t‑stats, p‑values, and inference by category/window.
Multi‑Factor Valuation
Primary (Structural) Demand
TAM: share of global wealth/M2 addressable by BTC.
Stock‑to‑Flow: scarcity proxy.
DCF‑style annuity: CAGR‑based cash‑like store‑of‑value utility.
Metcalfe’s Law: network effect (value ∝ users² / cost proxy).
Secondary (Cyclical) Premium:
Residual Market Price – Primary Fair Value.
Regress on liquidity (M2, balance sheet), real yields, futures funding/open interest, stablecoin supply growth.
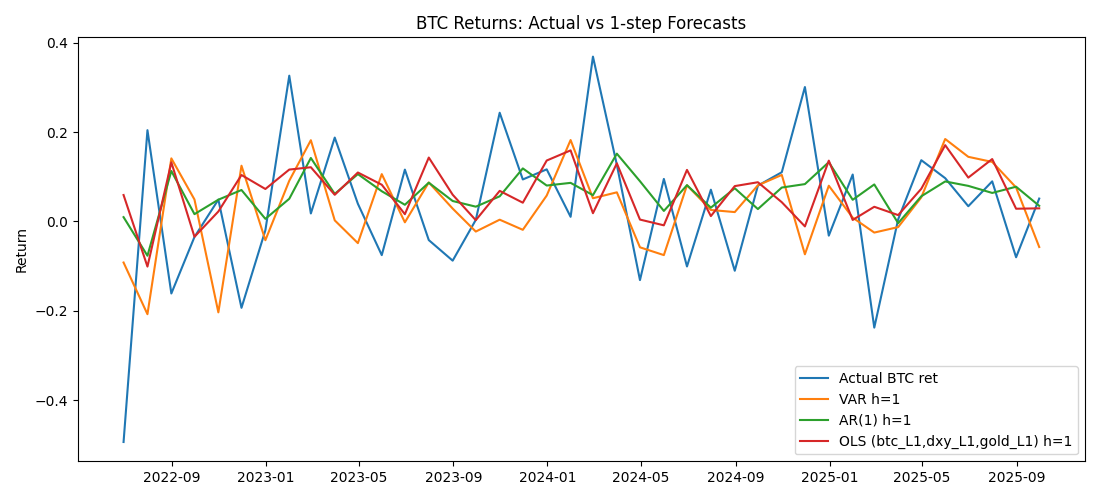
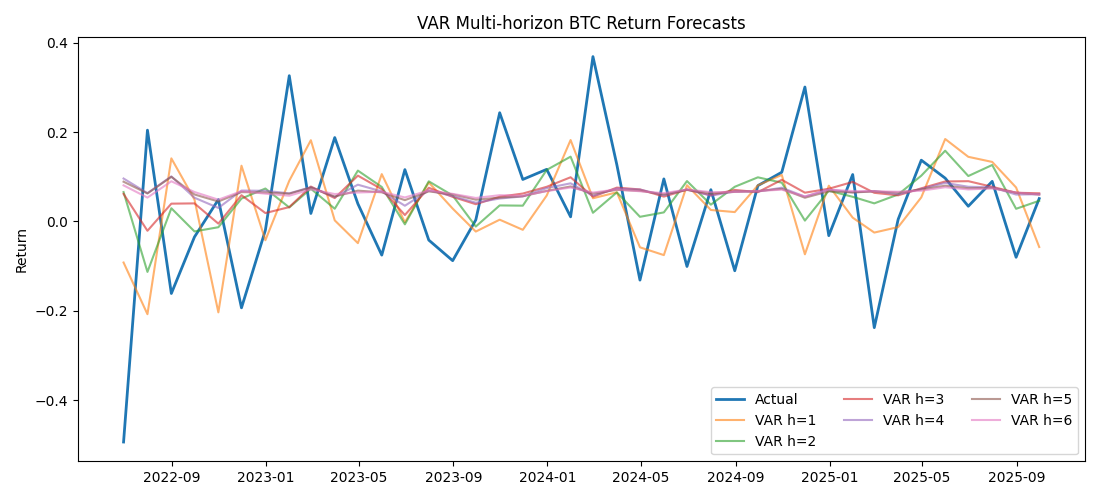
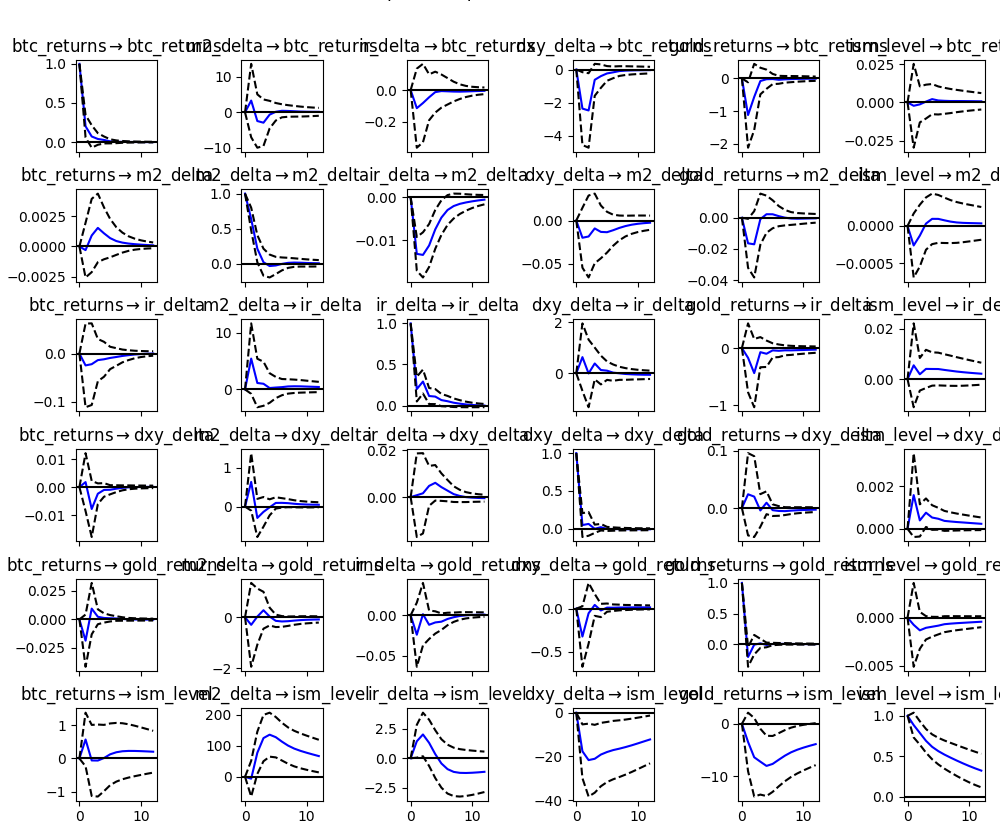
Macro Links (Monthly VAR/OLS)
Short‑term momentum in BTC; inverse DXY and inverse gold relationships at 1–2‑month horizons.
Limited evidence that M2/ISM/rates predict monthly BTC returns in this sample.
Outputs & UX
Valuation bands for 2025 (bear/base/bull) from the primary model + secondary premium overlay.
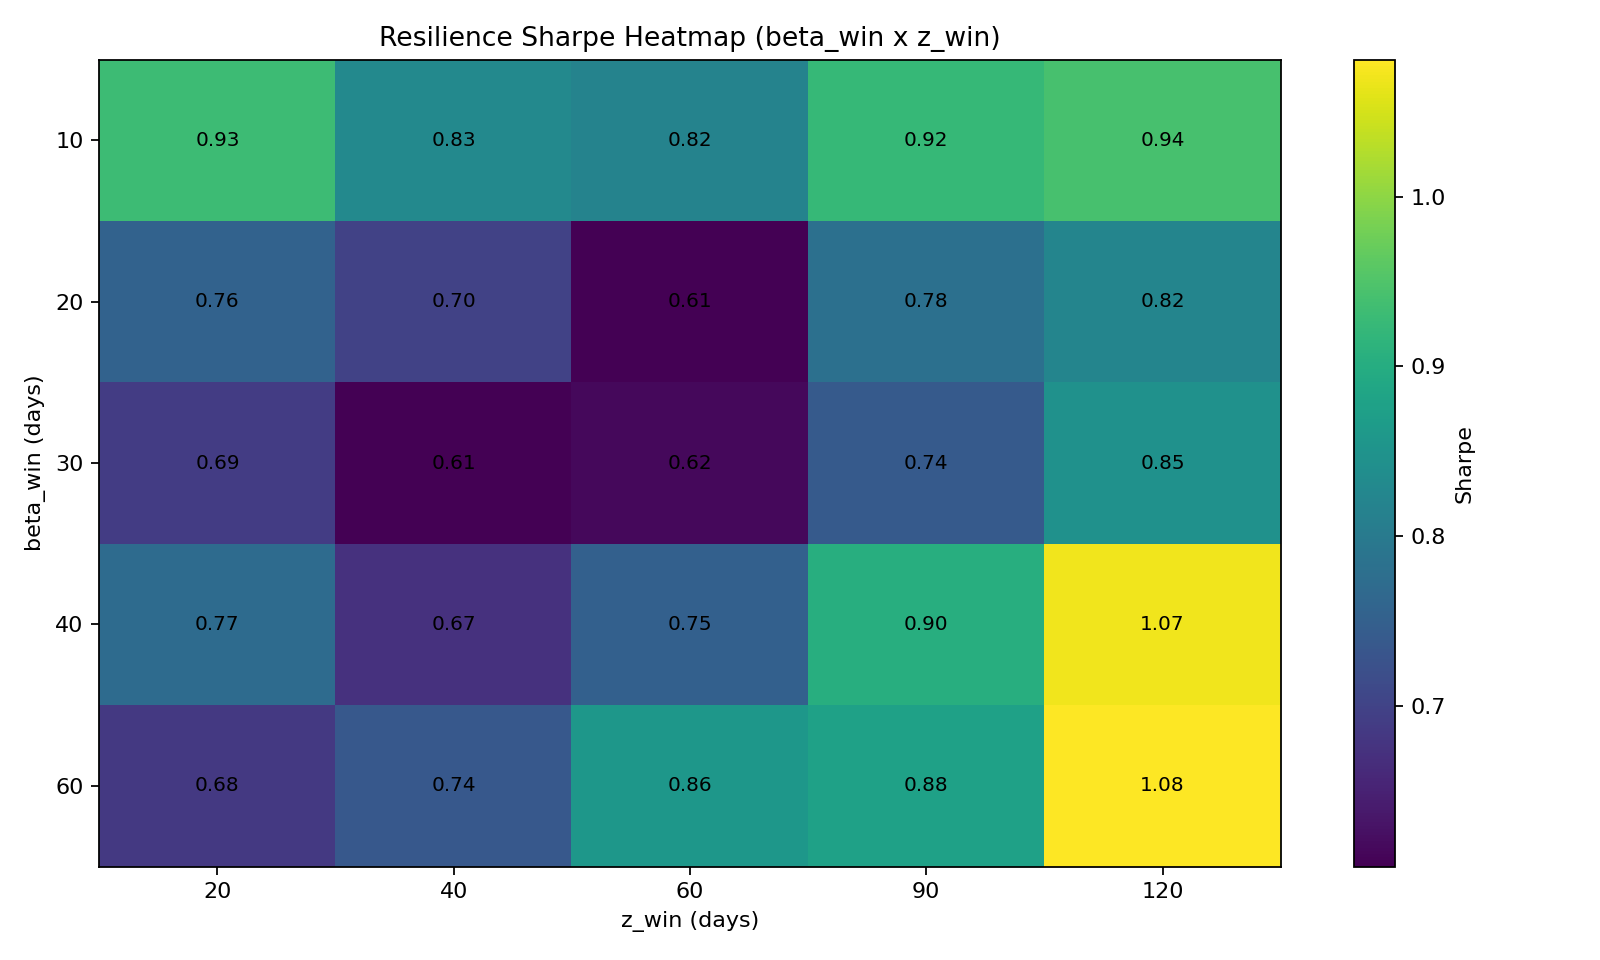
Heatmap: event type × window with significance stars.
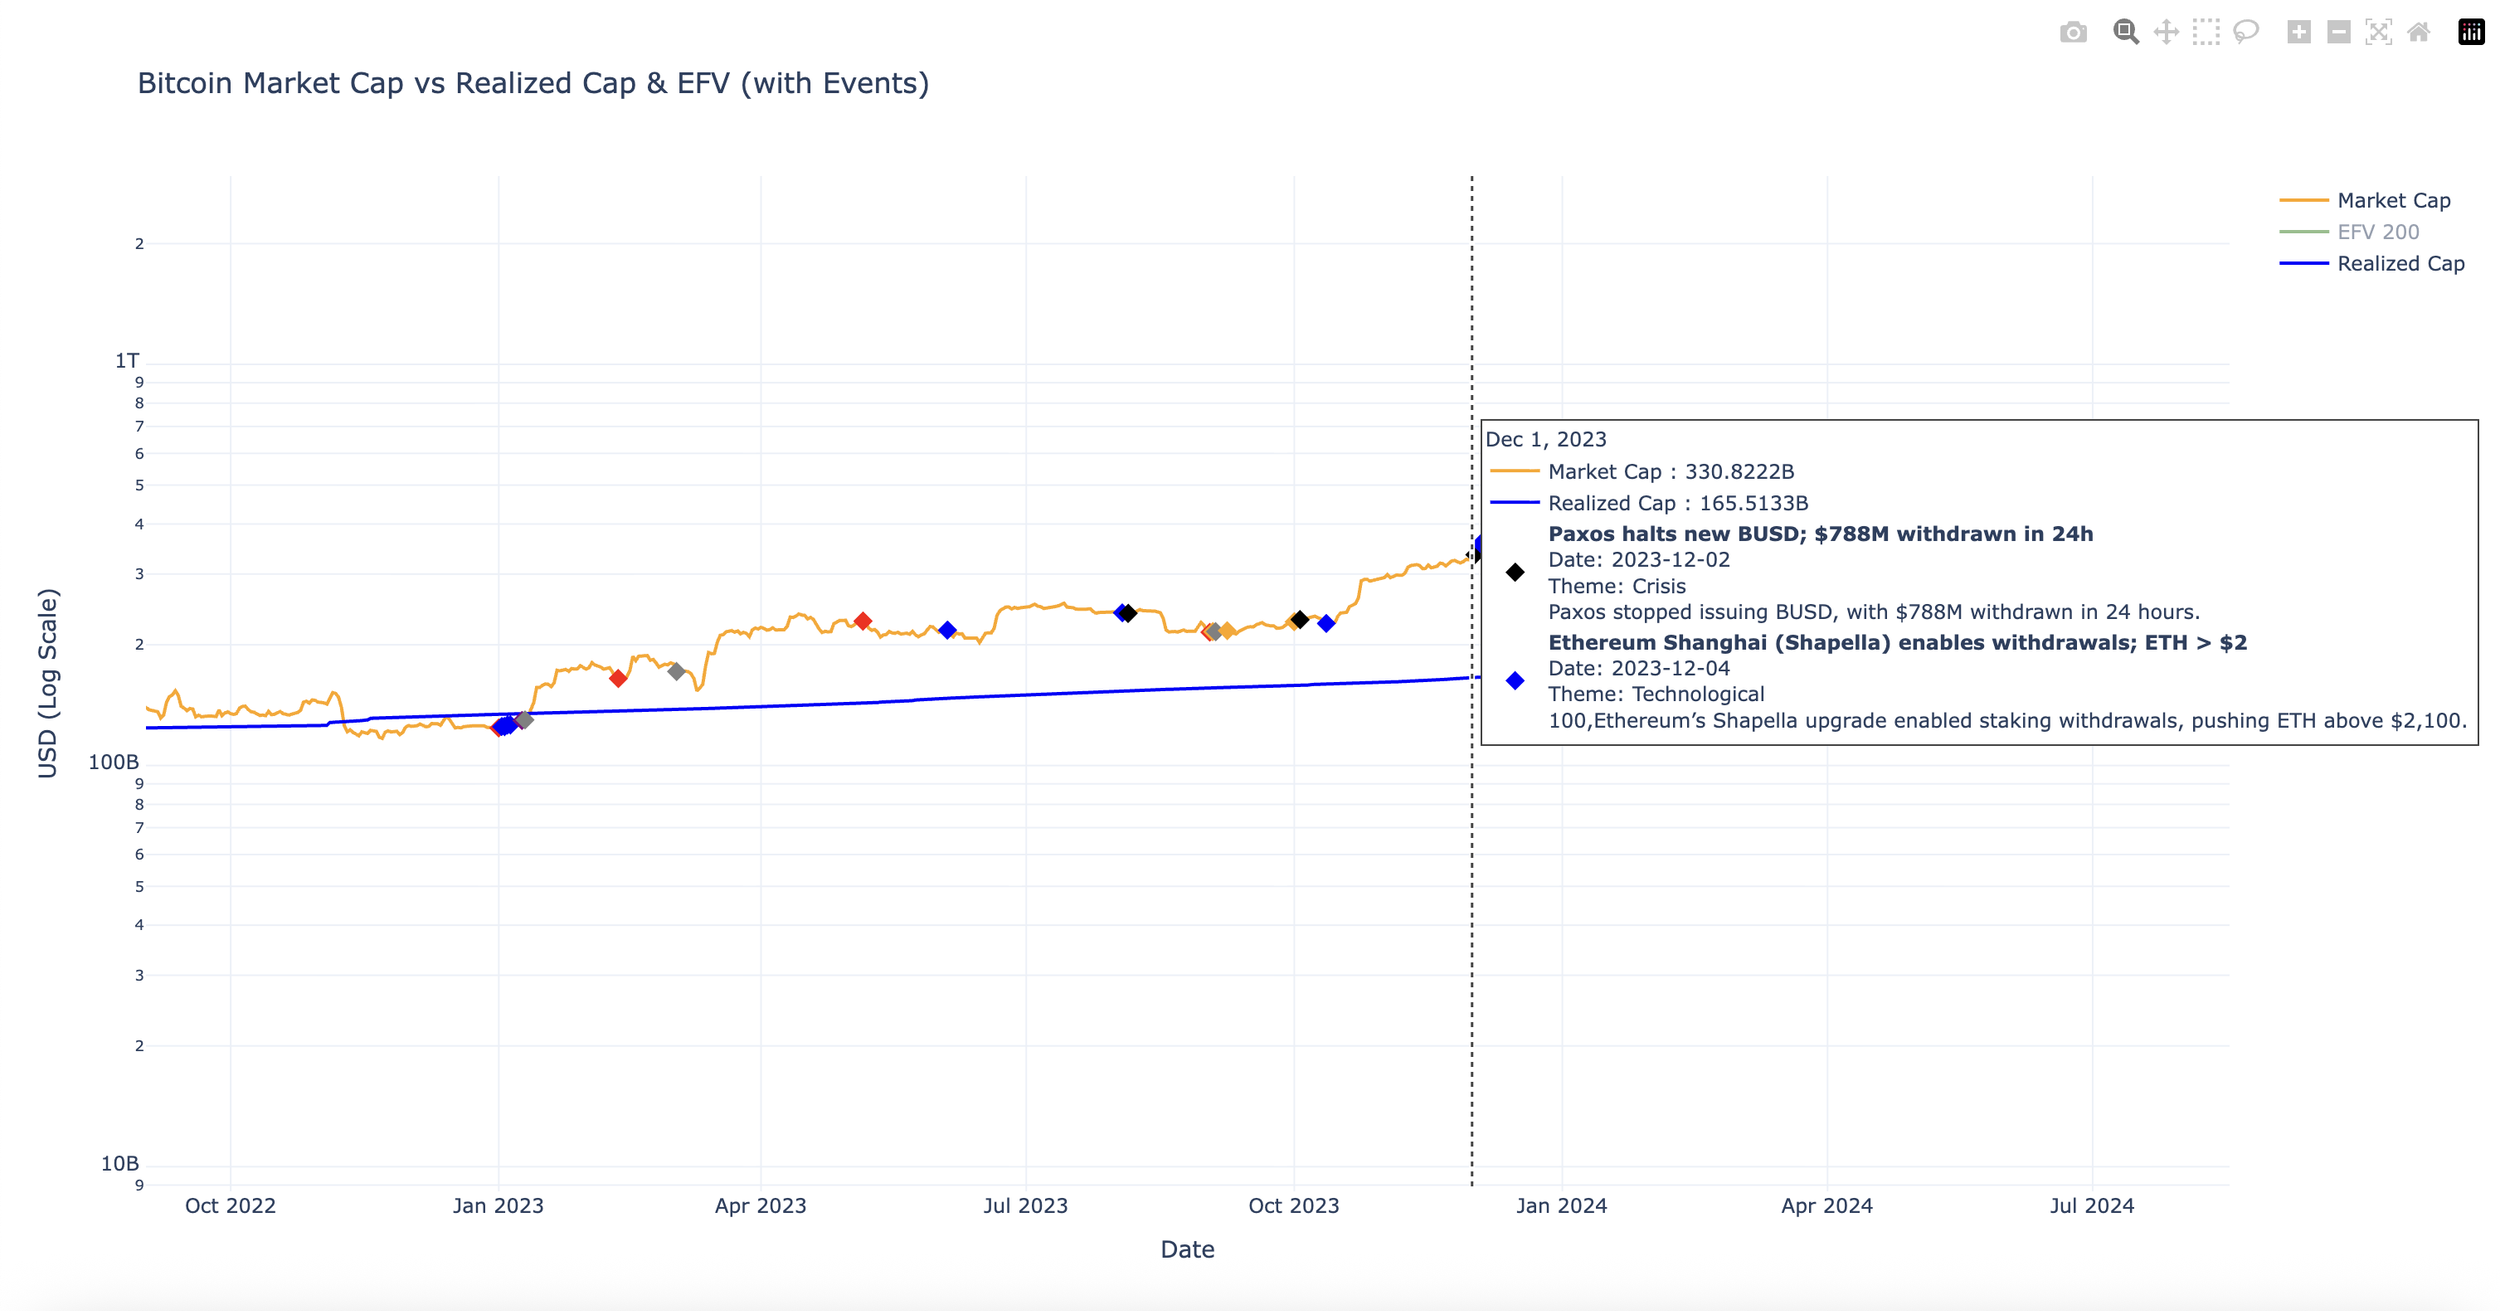
Time‑series panel: price, primary fair value, and secondary premium.
Practical Data Sources
On‑chain: Glassnode, Nansen, IntoTheBlock.
News & regulatory: Factiva/LexisNexis, CoinDesk archives, official gov/regulator sites.
Market & liquidity: futures OI/funding, stablecoin supply, CB balance sheets, real yields.
Tech Stack
Python (NumPy, pandas, statsmodels), matplotlib/Plotly for figures.
Jupyter for exploration; export to CSV/PNG for reproducibility.
Work with me
If you run digital‑asset research or risk and want a pragmatic builder who can measure catalysts, explain premiums, and ship tools, let’s talk.
Research/education only; not investment advice.